

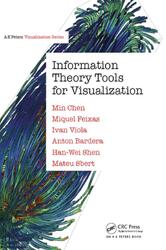
Information Theory Tools for Visualization, Chen M., Feixas M., Bardera A., 2017.
This book represents the first serious attempt to bring together all major uses of information theory in the visualization literature up to now. We, the authors of this book, started this journey in the autumn of 2014 with our individual branches of knowledge about the existing works. By the end of summer 2015, when the first draft was compiled from separately written chapters, we were astonished by the coverage and diversity of the footprints of information theory in the landscape of visualization. We hope that readers of this work will share our enthusiasm and confidence about the promising role of information theory in visualization. While information theory has provided volume visualization, flow visualization, and information with a variety of techniques, it has also shown its potential to underpin the theoretical foundation of visualization. Of course, we are fully aware that this is only the beginning. We therefore hope that this book will inspire a surge of new effort in furthering advancement in this endeavour.
Visual Coding in Noiseless Channels.
In data communication, coding schemes are broadly divided into two main categories, namely source coders and channel coders. A source coder focuses on the messages from the source, and tries to find the most compact representation of the messages. A channel coder focuses on the noise on the channel, and tries to find a cost-effective representation that can help detect or/and correct errors introduced by the channel. We study these two categories in the context of visualization in this section and Section 2.1.5 respectively.
Many encoding schemes in data communication can inspire us to develop new data abstraction and visual encoding techniques. In this section we give one example of such schemes to illustrate the relevance of source coding to visualization. We call this scheme entropy-based spatial mapping, which conceptually bears a strong resemblance to entropy coding in data compression and communication. The latter is a family of coding schemes, where fixed-length codewords are replaced with variable-length codewords. The well-known entropy encoding schemes include Huffman encoding, Shannon Weaver-Fano encoding, and arithmetic encoding.
Contents.
Foreword.
Preface.
Chapter 1 Basic Concepts of Information Theory.
1.1 ENTROPY.
1.2 RELATIVE ENTROPY AND MUTUAL INFORMATION.
1.3 INFORMATION SPECIFIC TO A PARTICULAR SYMBOL.
1.4 ENTROPY RATE.
1.5 JENSEN-SHANNON DIVERGENCE.
1.6 INFORMATION BOTTLENECK METHOD.
1.7 SUMMARY.
Chapter 2 Visualization and Information Theory.
2.1 INFORMATION-THEORETIC MEASURES IN VISUALIZATION.
2.1.1 Alphabets and Letters.
2.1.2 Quantifying Visual Information.
2.1.3 Information Sources and Communication Channels.
2.1.3.1 Information Sources.
2.1.3.2 Channels.
2.1.4 Visual Coding in Noiseless Channels.
2.1.5 Visual Coding in Noisy Channels.
2.2 INFORMATION-THEORETIC LAWS FOR VISUALIZATION.
2.3 INFORMATION-THEORETIC PROCESS OPTIMIZATION.
2.3.1 Data Processing Inequality.
2.3.2 Transformation of Alphabets in a Visualization Process.
2.3.3 Cost-Benefit Measures for Visualization Processes.
2.3.4 Examples of Cost-Benefit Analysis.
2.3.4.1 Interaction in Visualization.
2.3.4.2 Disseminative Visualization.
2.3.4.3 Observational Visualization.
2.3.4.4 Analytical Visualization.
2.3.4.5 Model-Developmental Visualization.
2.4 INFORMATION-THEORETIC LINKS: VISUALIZATION AND PERCEPTION.
2.4.1 Visual Multiplexing.
2.4.1.1 Multiplexing in Communication.
2.4.1.2 Multiplexing in Visualization.
2.4.1.3 Multiplexing and Information-Theoretic Measures.
2.4.2 Information-Theoretic Quality Metrics.
2.4.2.1 Differentiability of Glyphs.
2.4.2.2 Hamming Distance.
2.4.2.3 Quasi-Hamming Distance for Glyph Design.
2.4.3 User Studies in the Information-Theoretic Framework.
2.5 SUMMARY.
Chapter 3 Viewpoint Metrics and Applications.
3.1 VIEWPOINT METRICS AND BASIC APPLICATIONS.
3.2 FROM POLYGONS TO VOLUMES.
3.2.1 Isosurfaces.
3.2.2 Volumetric Data.
3.3 VISIBILITY CHANNEL IN VOLUME VISUALIZATION.
3.3.1 Visibility Channel.
3.3.2 Voxel Information.
3.4 IMPORTANCE-DRIVEN FOCUS OF ATTENTION.
3.5 VIEWPOINT SELECTION USING VOXEL INFORMATION.
3.6 APPLICATION TO ILLUSTRATIVE RENDERING.
3.6.1 Ambient Occlusion.
3.6.2 Color Ambient Occlusion.
3.7 SUMMARY.
Chapter 4 Volume Visualization.
4.1 TIME-VARYING DATA.
4.2 LEVEL-OF-DETAIL CHARACTERIZATION.
4.3 ISOSURFACES.
4.4 SPLITTING.
4.5 TRANSFER FUNCTION DESIGN.
4.6 MULTIMODAL VOLUME VISUALIZATION.
4.7 SUMMARY.
Chapter 5 Flow Visualization.
5.1 COMPLEXITY MEASURE OF VECTOR FIELDS.
5.1.1 Entropy Field.
5.2 COMPLEXITY MEASURES OF STREAMLINES.
5.2.1 Information Complexity of Streamlines.
5.2.2 Geometric Complexity of Streamlines.
5.2.2.1 Construction of Histograms.
5.2.3 Streamline Segmentation.
5.3 INFORMATION-AWARE STREAMLINE SEEDING.
5.3.1 View-Independent Method.
5.3.1.1 Initial Seeding.
5.3.1.2 Importance-Based Seed Insertion.
5.3.1.3 Redundant Streamline Pruning.
5.3.1.4 Reconstructing a Vector Field from Streamlines.
5.3.1.5 Seed Selection Result.
5.3.2 View-Dependent Method.
5.3.2.1 Maximal Entropy Projection (МЕР).
5.3.2.2 Seed Placement.
5.3.2.3 Entropy-Based Streamline Selection.
5.3.2.4 Finding Optimal Views.
5.4 INFORMATION CHANNELS FOR FLOW VISUALIZATION.
5.5 SUMMARY.
Chapter 6 Information Visualization.
6.1 THEORETICAL FOUNDATIONS OF INFORMATION VISUALIZATION.
6.2 QUALITY METRICS FOR DATA VISUALIZATION.
6.3 IT METRICS FOR PARALLEL COORDINATES.
6.4 MAXIMUM ENTROPY SUMMARY TREES.
6.4.1 How to Construct a Maximum Entropy Summary Tree.
6.5 MULTIVARIATE DATA EXPLORATION.
6.5.1 Variable Entropy.
6.5.2 Mutual Information between Variables.
6.5.3 Specific Information.
6.6 TIME-VARYING MULTIVARIATE DATA.
6.6.1 Transfer Entropy.
6.6.2 Visualization of Information Transfer.
6.7 PRIVACY AND UNCERTAINTY.
6.7.1 Metrics for Uncertainty.
6.8 MUTUAL INFORMATION DIAGRAM.
6.8.1 The Taylor Diagram.
6.8.2 Mutual Information Diagram.
6.8.3 Properties of the MI Diagram.
6.9 SUMMARY.
Bibliography.
Index.
Бесплатно скачать электронную книгу в удобном формате, смотреть и читать:
Скачать книгу Information Theory Tools for Visualization, Chen M., Feixas M., Bardera A., 2017 - fileskachat.com, быстрое и бесплатное скачивание.
Скачать pdf
Ниже можно купить эту книгу, если она есть в продаже, и похожие книги по лучшей цене со скидкой с доставкой по всей России.Купить книги
Скачать - pdf - Яндекс.Диск.
Дата публикации:
Теги: учебник по математике :: математика :: Chen :: Feixas :: Bardera
Смотрите также учебники, книги и учебные материалы:




Предыдущие статьи: